Basics
Dashboard
Last verified: October 4, 2026The Dashboard is the first page in the console. It tells you what needs your attention right now, and it holds your community’s access log: every entry attempt at your gates, allowed and denied.
What needs your attention
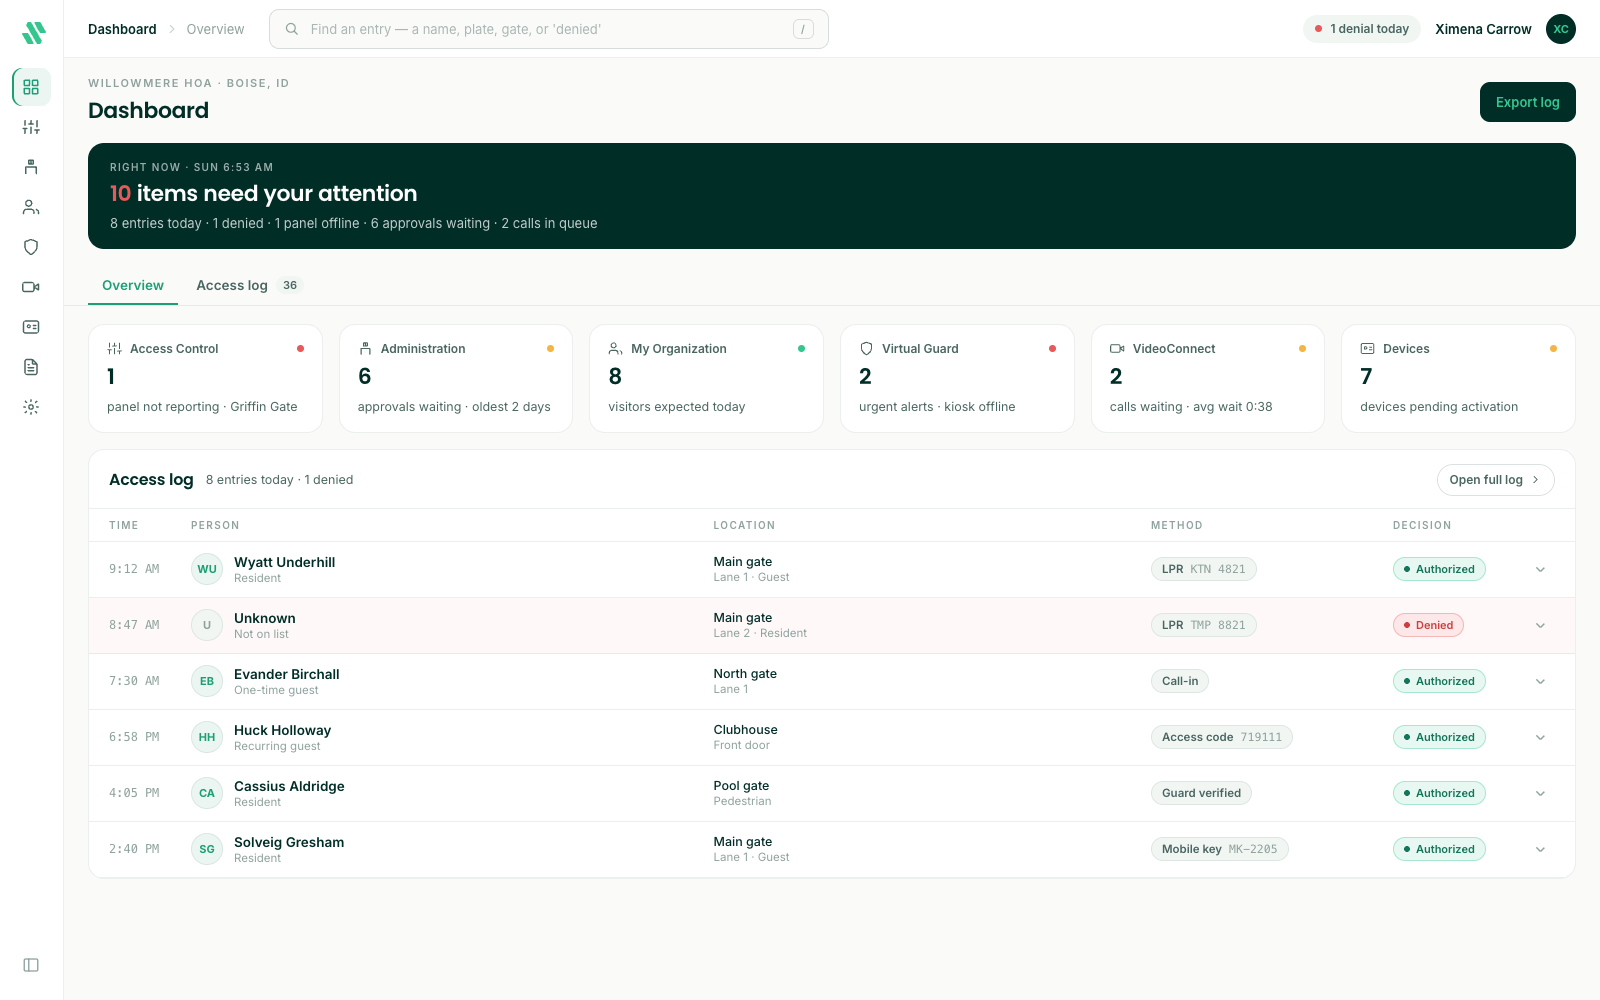
The dark band at the top counts the things waiting on you, such as panels that aren’t reporting, approvals waiting, calls in the queue and denials today. The line under it breaks the number down. When there’s nothing to do, it reads Nothing needs your attention.
The pill at the top right shows today’s denials, for example 2 denials today. Click it to open the access log showing only denied entries.
Overview
The Overview tab has one card for each part of the console your community uses. Each card shows a number and what it means, for example approvals waiting in Administration, panels not reporting in Access Control, or devices waiting to be activated in Devices. A green dot means there’s nothing to do there. Click a card to go to that page.
Under the cards, the Access log card shows the six most recent entries. Click Open full log to see the rest.
Read the access log
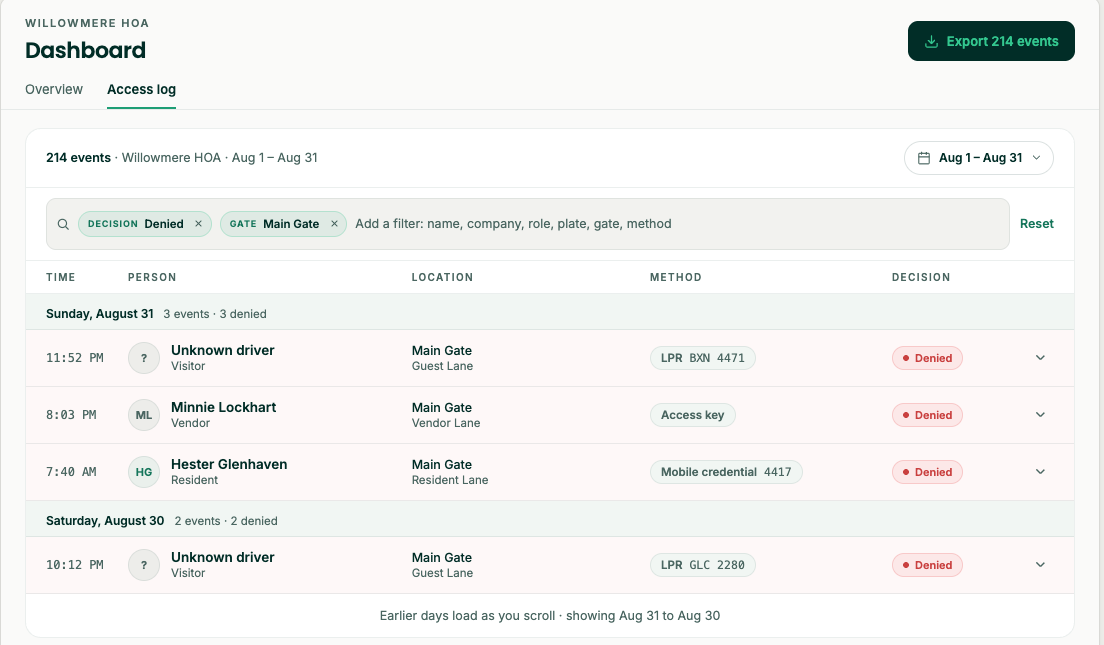
Open the Access log tab. Entries are grouped by day, newest first. Each day’s heading shows how many events it holds and how many were denied.
| Column | What it shows |
|---|---|
| Time | When the attempt happened. |
| Person | Who it was and their role, for example Resident or Recurring guest. Someone SAGE doesn’t recognize shows as Unknown and Not on list. |
| Location | The gate, and the lane or door. |
| Method | How they tried to get in, for example a plate read (LPR), a fob, an access code, a call-in, or a guard check, with the plate or credential number. |
| Decision | Authorized or Denied. |
Earlier days load as you scroll down. Times are in your community’s local time.
Pick the dates
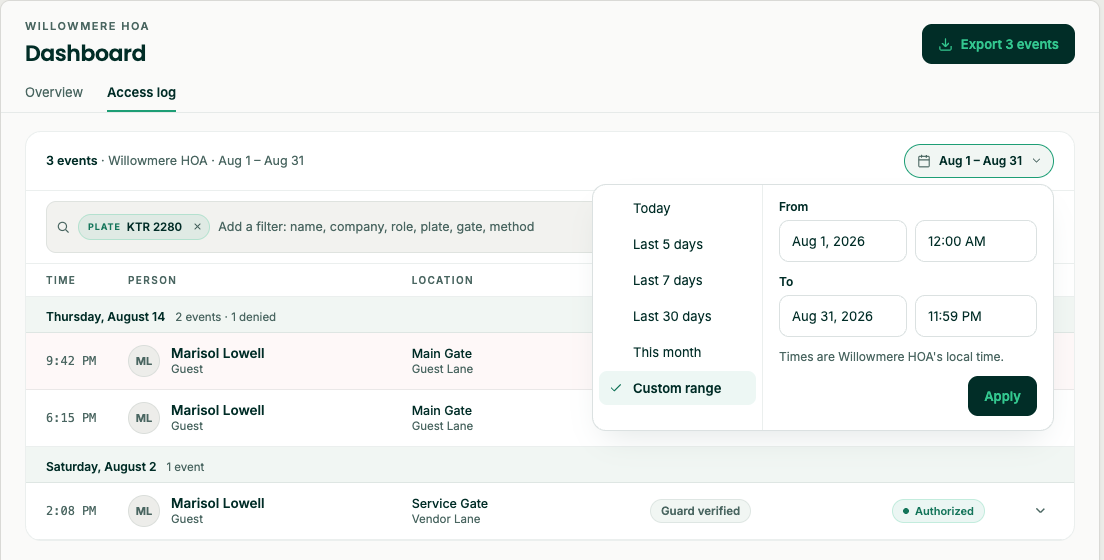
The log opens on the Last 5 days. To look further back, click the date button at the top right of the list and pick Today, Last 7 days, Last 30 days, This month, or Custom range. For a custom range, set the dates and times under From and To, then click Apply.
The line above the list says how many events are showing and for which dates.
The access log in the console goes back 180 days. For anything older, contact support@sagesystems.io.
Filter the log
Click in the filter bar above the list and add what you’re looking for: a name, company, role, plate, gate, method or decision. Each filter shows as a token, for example Plate KTR 2280. Click the × on a token to remove it, or Reset to clear them all.
See the details of an entry
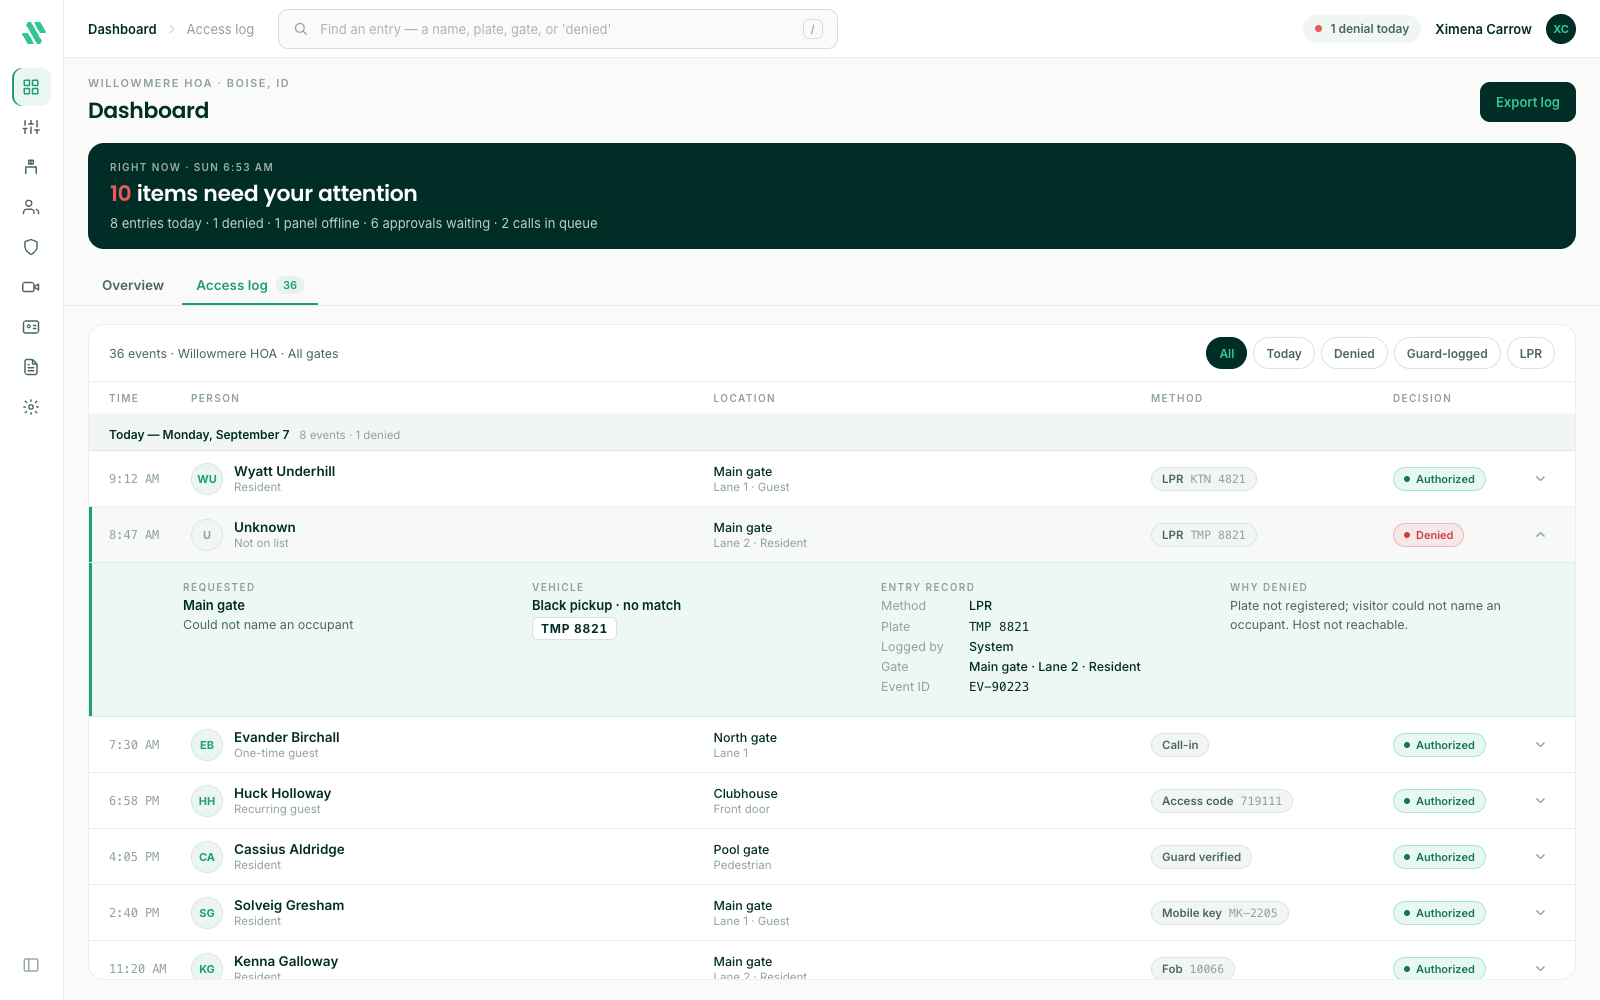
Click an entry to open it. You see where the person asked to go, the vehicle and plate if there was one, and the entry record: the method, the credential or plate, who logged it, the gate and the event ID. A denied entry also says why it was denied. Click the entry again to close it.
Search the log
Press / on your keyboard, or click the search box at the top, and type a name, a plate, a gate, or the word “denied”. The page switches to the access log and narrows it as you type. If nothing matches, the page suggests what to try instead.
Export the log
- On the Access log tab, pick the dates and add any filters. The export includes exactly the entries you’ve picked.
- Click the export button at the top right. It says how many entries it will export, for example Export 214 events. You get a CSV file.
If no entries match your dates and filters, nothing is exported and the page tells you so. Widen the dates or remove a filter, then try again.
If the connection drops
If the console loses its connection, the pill at the top right reads Reconnecting… and the counts on the page show the time they’re from. After 30 seconds without a connection, the pill reads Offline and a banner says you’re offline. You can still look at what’s on screen, but changes can’t be saved until you reconnect. When the connection comes back, the page updates by itself.
Need help?
Questions? Contact us at support@sagesystems.io.